By Steve and Gabriele at Causal Map, with Dena at Southern Hemisphere.
The Love Alliance is a five-year partnership, running from 2021 to 2025, that works to improve the health and rights of key populations affected by HIV, meaning sex workers, people who use drugs, LGBTQ+ people and people living with HIV, across ten countries in Africa and through regional and global advocacy. It is funded by the Dutch Ministry of Foreign Affairs, administered through Aidsfonds, and delivered by a consortium of partner organisations working through advocacy, capacity-strengthening and movement building. Its theory of change is a tidy ladder (Figure 1): strategies at the bottom, then short, medium and long-term outcomes, then goals at the top.
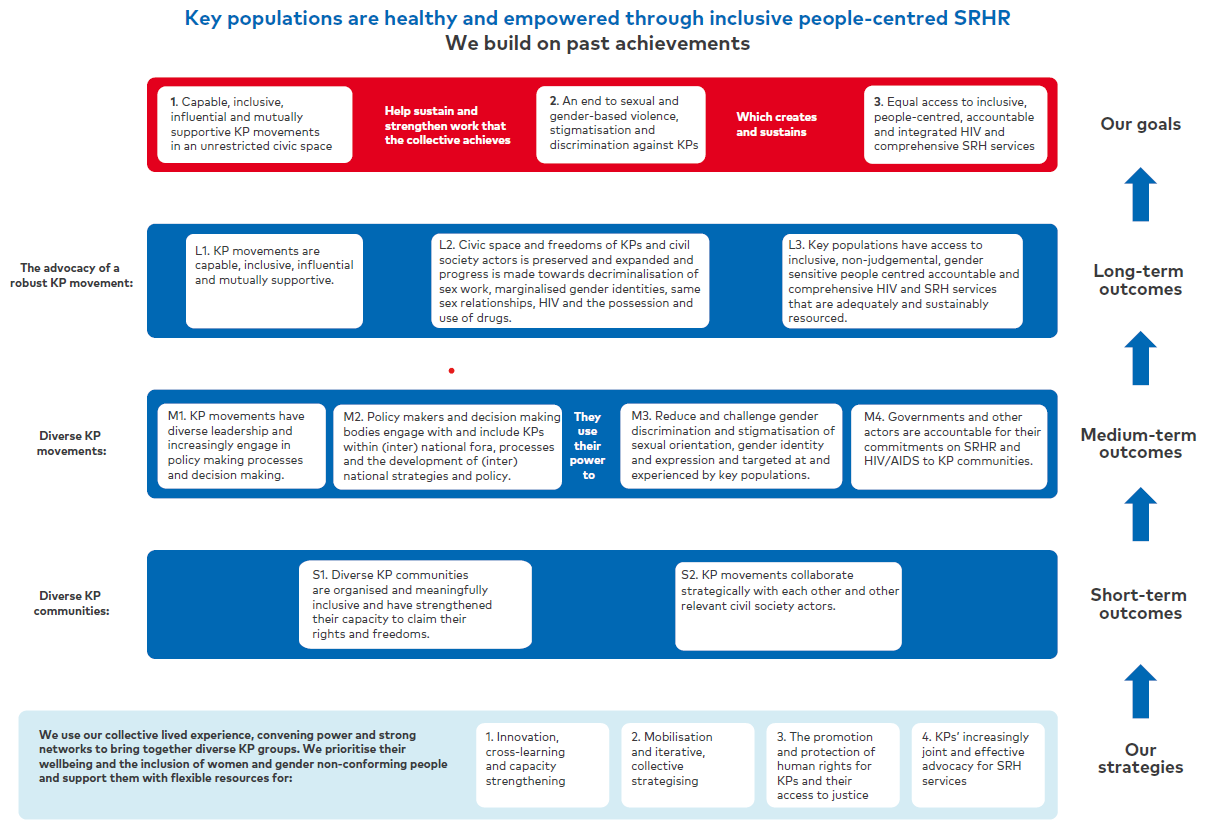 Figure 1. The programme's official theory of change: a layered ladder from strategies up to goals.
Southern Hemisphere, a research and evaluation consultancy, was asked to carry out the end-term evaluation of the whole partnership: how well it had worked, how plausibly it had contributed to change, and whether the gains could last. They did this with a participatory, mixed-methods design that wove together contribution analysis, realist evaluation (reading each case as a context, a mechanism and an outcome), thematic analysis of the interviews, a partner survey and a large body of programme documents, at country, regional and global levels.
What we look at here is one strand of that work: how the Causal Map team supported Southern Hemisphere to bring causal mapping into the evaluation. Causal mapping means collecting, coding and visualising the interconnected causal claims, the "links" between "factors", that people make in narrative data like reports and interviews. Each link records one claim that someone said one thing influenced another, and it keeps the verbatim quote behind it. Assemble enough of them and a map appears: a picture of the routes along which people said change happened, from the programme outwards. And because the evidence here ran to many thousands of claims, the Causal Map team did it with AI for scale.
This is a joint account, written from both sides of that collaboration. When we say "we" we mean the three of us looking back together; where the difference matters we say "the Causal Map team" for the mapping and "Southern Hemisphere" for the evaluation. And we enjoyed the work. The evaluators pushed hard on the method, which is exactly what you want, and it held up.
What do you do with too much evidence?#
The usual complaint in evaluation is that there is too little evidence. Here we had the opposite, which is the nicer problem to have, until you sit down to write the report. Coding all the narrative data produced over 22,000 causal claims; even after setting aside the planned and hypothetical ones and keeping only claims about what factually happened, 13,756 links remained to make sense of. A team reading and hand-coding at that scale would be exhausted long before reaching a defensible overview, and human coders get tired, and bored, and pay uneven attention. You could sample, but then you are back to guessing which stories matter.
So the Causal Map app uses a large language model as a low-level coding assistant rather than an oracle. It does the mechanical work of finding and coding every causal claim across all 176 documents, while the human analysts write the coding instructions, check the output against the quotes, and interpret the maps. The AI is tireless where humans tire, and every claim it codes can be traced back to the sentence it came from. That brings the real question into focus: how to hold thousands of separate voices in one view without flattening them into a slogan, metrics or cherry-picking the quotes that flatter the programme.
What the Causal Map team delivered, and how the report used it#
Our contribution started with that coding pass over the whole corpus. From its results we built maps at three scales, one for each of the ten countries, one for each region, and one global map, so a finding could be stated nationally, regionally or programme-wide. We cut the same data thematically too, into maps for capacity strengthening, movement building, advocacy, policy influence and sustainability, each feeding the matching chapter's "Causal map analysis". Every map came with a written narrative tracing its strongest pathways, counting the links, and saying plainly where the evidence was solid and where it was thin. We compared the countries against one another, and found that nine factors were mentioned markedly differently from one place to another: "key populations have increased capacity" stood out in Mozambique, while "a hostile legal and political environment" loomed large in Uganda and barely registered in Egypt. We traced the feedback loops, the virtuous circles and the vicious ones discussed below. And we set the programme's official theory of change against the pathways people actually described, which fed the report's verdict on whether each of its assumptions had held.
In the report's words, the maps were used "to visualise and test causal dynamics across large volumes of qualitative and secondary evidence and to support programme-wide sense-making", in collaboration with the Causal Map team, and they fed the validation workshops where findings were checked with the task force and in country.
The maps were also only one of three lenses. The evaluators set the macro picture from the causal map against the micro picture from each country's contribution story (its context-mechanism-outcome reading), and against a thematic analysis of the same interviews. As the report puts it, change in Love Alliance was "analysed in three different ways, and on different scales, but using mostly the same data sources." Where the three agreed, a finding was safe; where they diverged, that was worth chasing.
Figure 2 is the overall map drawn from the country data. The size of each box and the numbers on it show how often that factor was mentioned; the arrows show claimed influence; darker green factors sit nearer the ends of chains (outcomes), lighter ones are drivers; arrowhead colour shows whether the claimed effect was positive or negative.
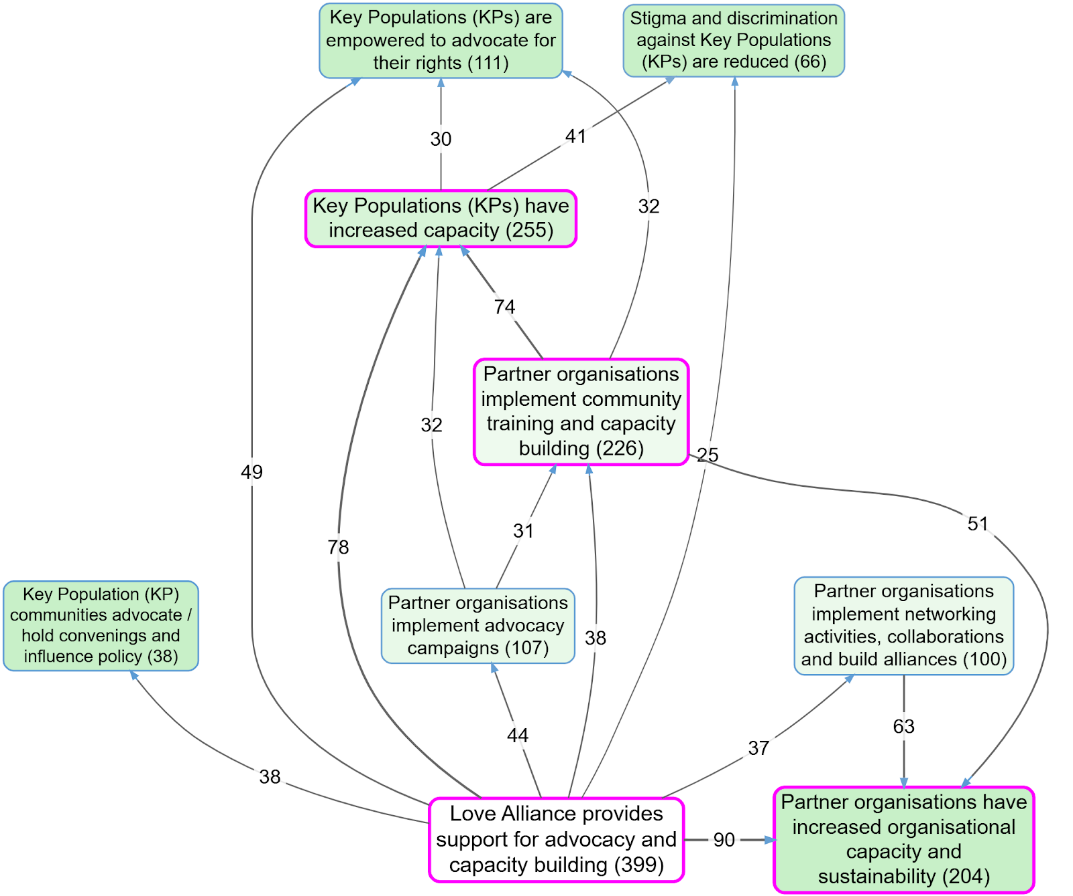 Figure 2. An overall causal map built from what people said. The largest box, "Love Alliance provides support for advocacy and capacity building", is the most frequently mentioned factor and the dominant driver. Numbers are citation counts.
The programme's support flows first into local partner organisations, which build the capacity of the communities they serve; that capacity then feeds advocacy, peer support and a stronger movement. The dominant story practitioners told was rarely "we delivered outputs and outcomes followed". It ran closer to "we built each other up, and that was the point" and the maps help illustrate the emphasis put by practitioners on that story: across the whole country-level dataset the single most-cited factor, with 399 citations, was Love Alliance support for advocacy and capacity building.
One pathway through Figure 2 shows how the counts fed the findings. Love Alliance support connects to partners running advocacy campaigns (cited 44 times), which feeds into community training and capacity building (31), and from there the map fans out into key populations having increased capacity (74), key populations empowered to advocate for their rights (41), and reduced stigma and discrimination (32). The report carried those counts into its effectiveness chapter, using them to argue that partner-led advocacy was a central driver of change, enabled by Love Alliance funding and by the capacity building around it.
The maps also showed something the Theory of Change didn't plan for: reinforcing loops. In the movement-building view (Figure 3 below), networking and collaboration sit at the centre as a hub, and two virtuous circles appear, one where growing community capacity feeds peer support which feeds capacity again, and one where networking enables advocacy campaigns which generate more networking.
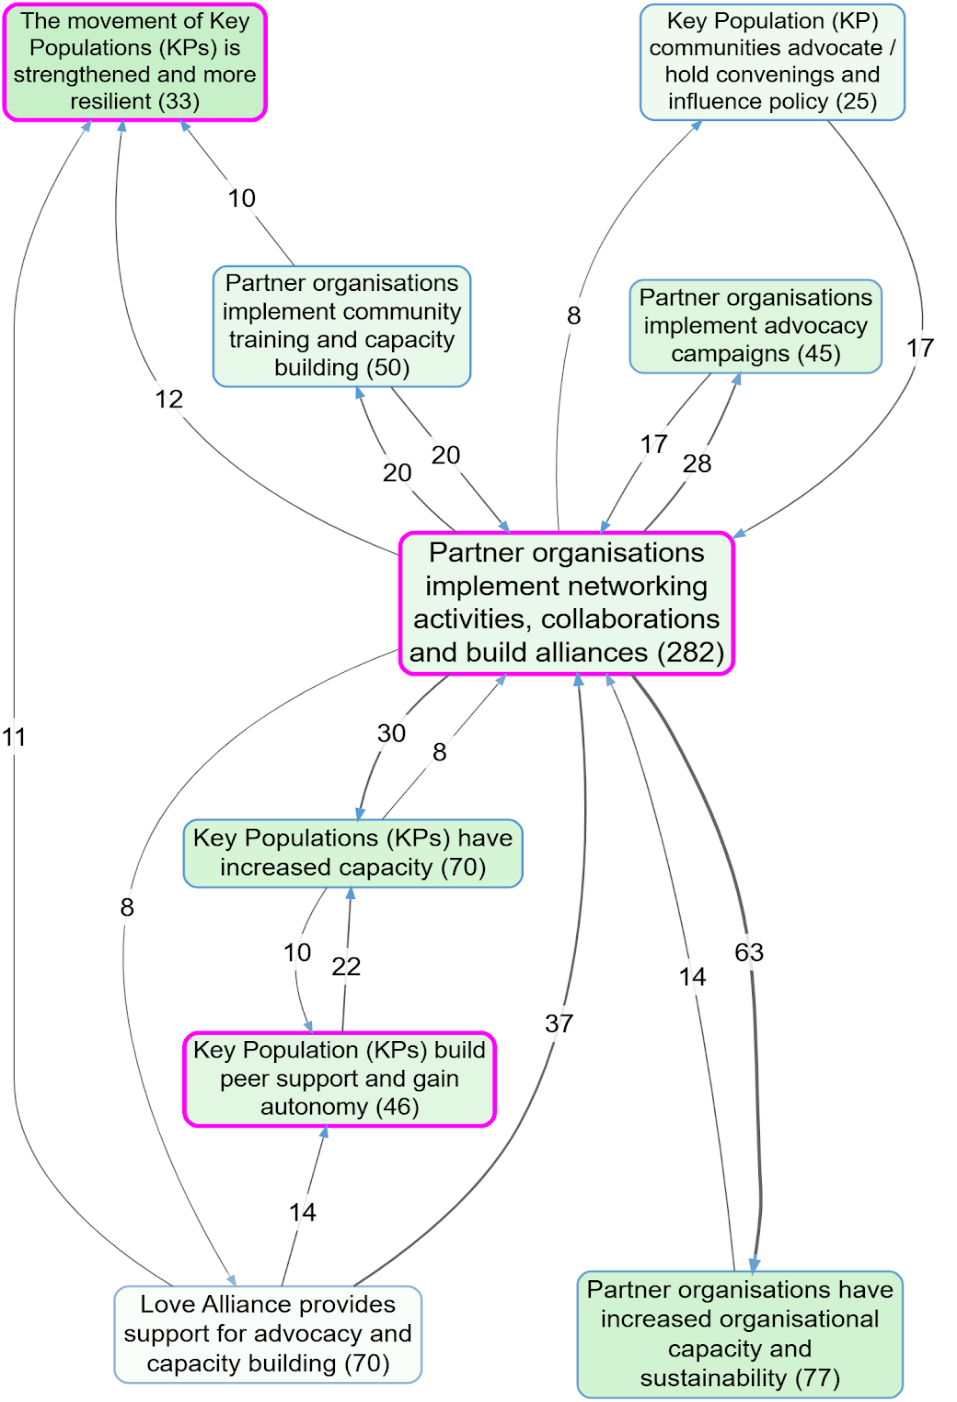 Figure 3. The movement-building view. "Partner organisations implement networking activities, collaborations and build alliances" is the central factor, with reinforcing feedback loops around it.
One respondent, in a group interview in Zimbabwe, put the hub plainly: "The coalitions and partnerships also worked, there is indeed power in numbers ... It was actually this strong partnership which also made things to work for us."
The dataset is overwhelmingly positive in tone, which is worth seeing rather than assuming. Of the factual links, far more were coded positive than negative.
| What was coded | Count |
|---|---|
| Documents used (of 193 coded) | 176: 79 country reports, 97 transcripts |
| Causal claims coded in total | over 22,000 |
| Factual links used in the maps | 13,756 |
| ... positive / negative / neutral | 10,366 / 2,960 / 151 |
Reading a map source by source#
A map of thirteen thousand links is only the beginning of the work. The real work is interrogating it and the Causal Map app supports this: for a given pathway, which sources actually told that story, and what did they say?. You can write a vignette, a short commentary on a chosen pathway from the perspective of the individual sources behind it, and you can trace a path back to the sources and the verbatim quotes that evidence each step. This is where a map is tested and enriched rather than just admired, and it is much of what we contributed beyond the maps themselves.
Take a real example from this evaluation. Partway through, the evaluation team was warried that Love Alliance's advocacy programming itself could be provoking a backlash against key populations. Rather than argue from impression, we put the question to the data and traced it through the relevant sources, 43 of the 116 in that filtered subset. The evidence pointed the other way. In every account that mentioned backlash or anti-rights movements, Love Alliance's support appeared as a force helping communities resist it; none portrayed it as the cause. A partner connected to the Dutch Embassy in South Africa described the support as "also helping to counter the backlash against women's rights and LGBT rights". A focus group said it ensured "that communities are empowered to resist and respond to anti-rights movements in meaningful ways". In Kenya, strengthened legal awareness was "especially vital in the face of growing anti-LGBTIQ movements ... where communities have used their strengthened legal awareness to challenge discrimination and defend themselves more effectively". In Nigeria, a participant valued help to "understand the legal framework that is Prohibiting ... and then how do we push for some kind of incremental change". In East Africa, the support "has helped ensure that advocates have safety nets, can challenge criminalization laws, and can educate policymakers".
That does not mean the maps painted everything rosy. Filtering the same data for negative claims surfaced a real and important dynamic: a hostile legal and political environment that hinders advocacy and, worse, reinforces itself. The report drew this straight from the map as its primary threat to sustainability, a self-reinforcing negative loop with a count of 232 and an average sentiment of -1.00. The maps also caught the harder truth that empowered advocacy can itself provoke more hostility, which then dampens advocacy: a backlash loop visible only once you filter for negative-sentiment links. The method could hold both the positive pathways and the real risks in the same evidence base, and tell them apart by going back to the sources.
What causal mapping does not do#
The maps are heavily filtered. To stay legible they show only the most-mentioned factors and links, so the absence of a link on a map does not prove the absence of that influence in the world, only that it was not among the most cited. A citation count measures how often something was said. It says nothing about how strong the effect was: a pathway mentioned a hundred times is not therefore twice as powerful as one mentioned fifty times. And longer chains, from support all the way to reduced stigma, are always less cited than the first short steps, so the downstream outcomes rest on a thinner evidence base. Say so, every time.
Above all, this is not causal inference. The map does not turn "twenty people said so" into "therefore it is so". It identifies and organises the evidence; the warranting stays the evaluator's job, and is best done with an explicit, written discipline (see the quality-assurance companion and the minimalist coding stance). Reading a map as if it already proved its pathways, especially across sources who each told only part of the story, is the transitivity trap, and it is the single thing most worth guarding against.
Why this helps#
You can hold thousands of voices in one picture, at a scale no hand-coding could reach, and still keep faith with each one, because every link on the map carries the quote it came from. You can show a funder the pathways people actually described, loops and all, next to the ToC they planned, and have a debate about the difference. When a doubt surfaces, like the backlash question above, you can put it to the data and trace it through the sources rather than trade impressions. And the maps are live: each one is a bookmark in the Causal Map app, so anyone who doubts a link can click through and read the evidence behind it.
The ToC tells you where the programme hoped to go. The map shows you the country people actually travelled through, and lets you decide, in the open, how much of the journey you believe.
The mid-term review: where it started#
The end-term evaluation described above was not our first time working with Southern Hemisphere on the Love Alliance. In 2023, Southern Hemisphere was contracted to carry out the mid-term review (MTR) of the partnership, covering the first two and a half years of implementation across all eight countries, and they brought the Causal Map team in to handle the causal mapping strand. The evaluation ran from March to September 2023 and produced a 198-page report.
This was, as the MTR report itself noted, "one of the very first applications of AI-driven Causal Mapping in evaluation research". Previously it had not been possible to provide this kind of causal analysis on such a large body of documents in such a systematic way. The Causal Map team coded the full set of partner reports to the Love Alliance (the document review) and the complete set of interview transcripts from across the partnership, creating around 4,000 causal links: roughly 2,500 from the document review and 1,500 from the interviews.
The method was the same as in the later end-term evaluation, but at this stage it was still very new. The AI was instructed to code the text freely, then the analysts collated the labels into a systematic set of factors aligned, where possible, to the partnership's Theory of Change. The AI then recoded all documents with the refined labels. One finding that stood out: the AI created a factor category that was not in the official ToC at all, "participation in community and national affairs", which turned out to be central to how change actually happened in practice.
The MTR's causal map produced an "empirical Theory of Change", showing how respondents actually spoke about and understood change, set against the partnership's planned pathways. The top factors by number of sources mentioning them were received funding (47 sources), participation of the reporting organisation in community and national affairs (37), advocacy activities (45), capacity building (49) and empowerment of key population groups (53). Received funding was the main driver, directly influencing all other causal connections. A key causal chain ran from advocacy activities through capacity building to improved access to services and improved knowledge among key population groups, leading to empowerment.
The maps were used in each of the eight country chapters to triangulate with contribution analysis, thematic analysis and quantitative indicator data.
That mid-term collaboration proved the method could work at scale on a real, multi-country evaluation with sensitive and complex subject matter. It was the reason Southern Hemisphere came back for the end-term evaluation two years later, this time with a much larger dataset (over 22,000 causal claims against the MTR's 4,000) and a more refined workflow. The MTR was the proof of concept; the ETE was the full deployment.
Ready for more#
We have tended to describe causal mapping as a preparatory step: we organise the evidence so that someone else can do the evaluation. The companion paper on quality assurance makes the same modest case, and rightly, because the final evaluative judgement belongs to the evaluation team. But look at what the maps did here. They tested the programme's theory of change against the pathways people actually described. They named the main threat to sustainability. They settled the backlash question by going back to the sources. That is evaluative work, done in the open and backed by quotes at every step. So from our side at Causal Map, we know we are ready to take on a bigger part of the evaluation burden: working alongside evaluators rather than standing in for their judgement, but carrying far more of the analysis and sense-making than the words "preparatory step" suggest.