I was inspired by a recent talk by Jewlya Lynn about a causal mapping evaluation she and her team conducted (2026), in particular how they made evaluative judgments about the overall strength or robustness of evidence for the claim that one thing influenced another. We have been working on a similar idea and Jewlya's excellent report has encouraged us to move it forward.
So what is the problem exactly?
After your initial causal mapping, you will usually end up with multiple causal claims for a given single link or path from X to Y.
The Causal Map app partly grew out of our causal mapping work with QuIP evaluations. QuIP has its own way of dealing with quality and robustness of evidence. And it works mostly with relatively homogenous data sets (similar interviews with sets of similar respondents) so "number of links" can be a ballpark proxy for "strength of connection". But when working with heterogeneous sources of evidence, this does not work. In the past we have said that it is up to the analyst to look at the claims and make their own assessment about the strength of a claim that one thing influenced another, perhaps via multiple steps. But this is quite a big ask for the analyst to look at all the information from all the causal claims each time.
Just a reminder about our terminology around "links:"
Normally, not one of these possibly hundreds or thousands of causal claims, grouped into many bundles, is incontrovertible. Sometimes we call each of these claims "evidence" but only in a weak sense of "something we could take into consideration when weighing up the validity of the claim that X causally influenced Y". Usually these links — singly or as part of bundles — have not yet passed any test at this stage or been compared to any standard.
So how can we submit our links and bundles of links to this kind of assessment?
What we can already do using existing Causal Map functionality is filter individual links. For example, we can (during or after initial coding) just add a tag doubtful for doubtful claims and exclude these from most or all visualisations using a "include tags" or "exclude tags" filter. But these judgements are based only on individual links. In actual evaluation and research practice there is a strong case for making more global assessments about the quality or robustness of the complete set of links within the bundle. So we add a new layer to the workflow and transform a map consisting of very many individual links within bundles into a map consisting just of a single links representing each bundle, each of which carries a global assessment of the quality or the business of the evidence within the original, unassessed, bundle.
The workflow goes from something like this (3 unassessed links):
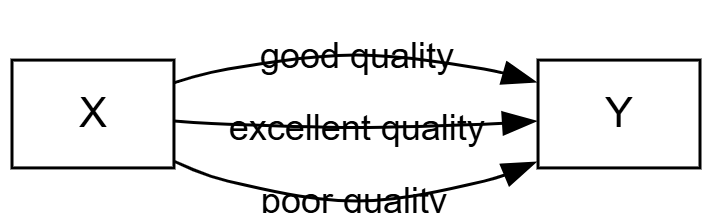
... to something like this (1 assessed link) ....
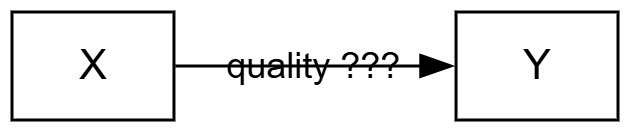
So all four links are present in the database, but we always show either the assessed links or the unassessed links.
In more detail:
- Analyst finishes coding the map (whether human coding, AI coding or some combination)
- Analyst considers each bundle of links (including bundles that might contain only one link) and judges the quality/strength of the evidence
- Analyst collapses the information in the bundle into a single new link with one or more quality assessments. In the simplest case this could be:
- Robust yes/no
- or: Robustness 1-5
- This means that for each bundle, there is a set of usually multiple "unassessed" links and a single "assessed" link. So from now on we will normally want to view either only the assessed links or (less often) only the unassessed links.
- Analyst uses the existing links table, pivot tables and/or map formatting to display these assessed links. Most obviously, they can show overall maps with only the quality-assessed links, formatted according to quality.
It's about saying
I the analyst have looked at this chunk of quotes and contexts for this one bundle and I vouch for the judgement that it's enough to say yes there's something real going on here.
The big question is of course, what criteria should we use to make these robustness or quality assessments. The answer has to be based on use: what are we actually trying to do here? We might for example want to focus on the quantity or quality or robustness of the evidence taken as a whole.
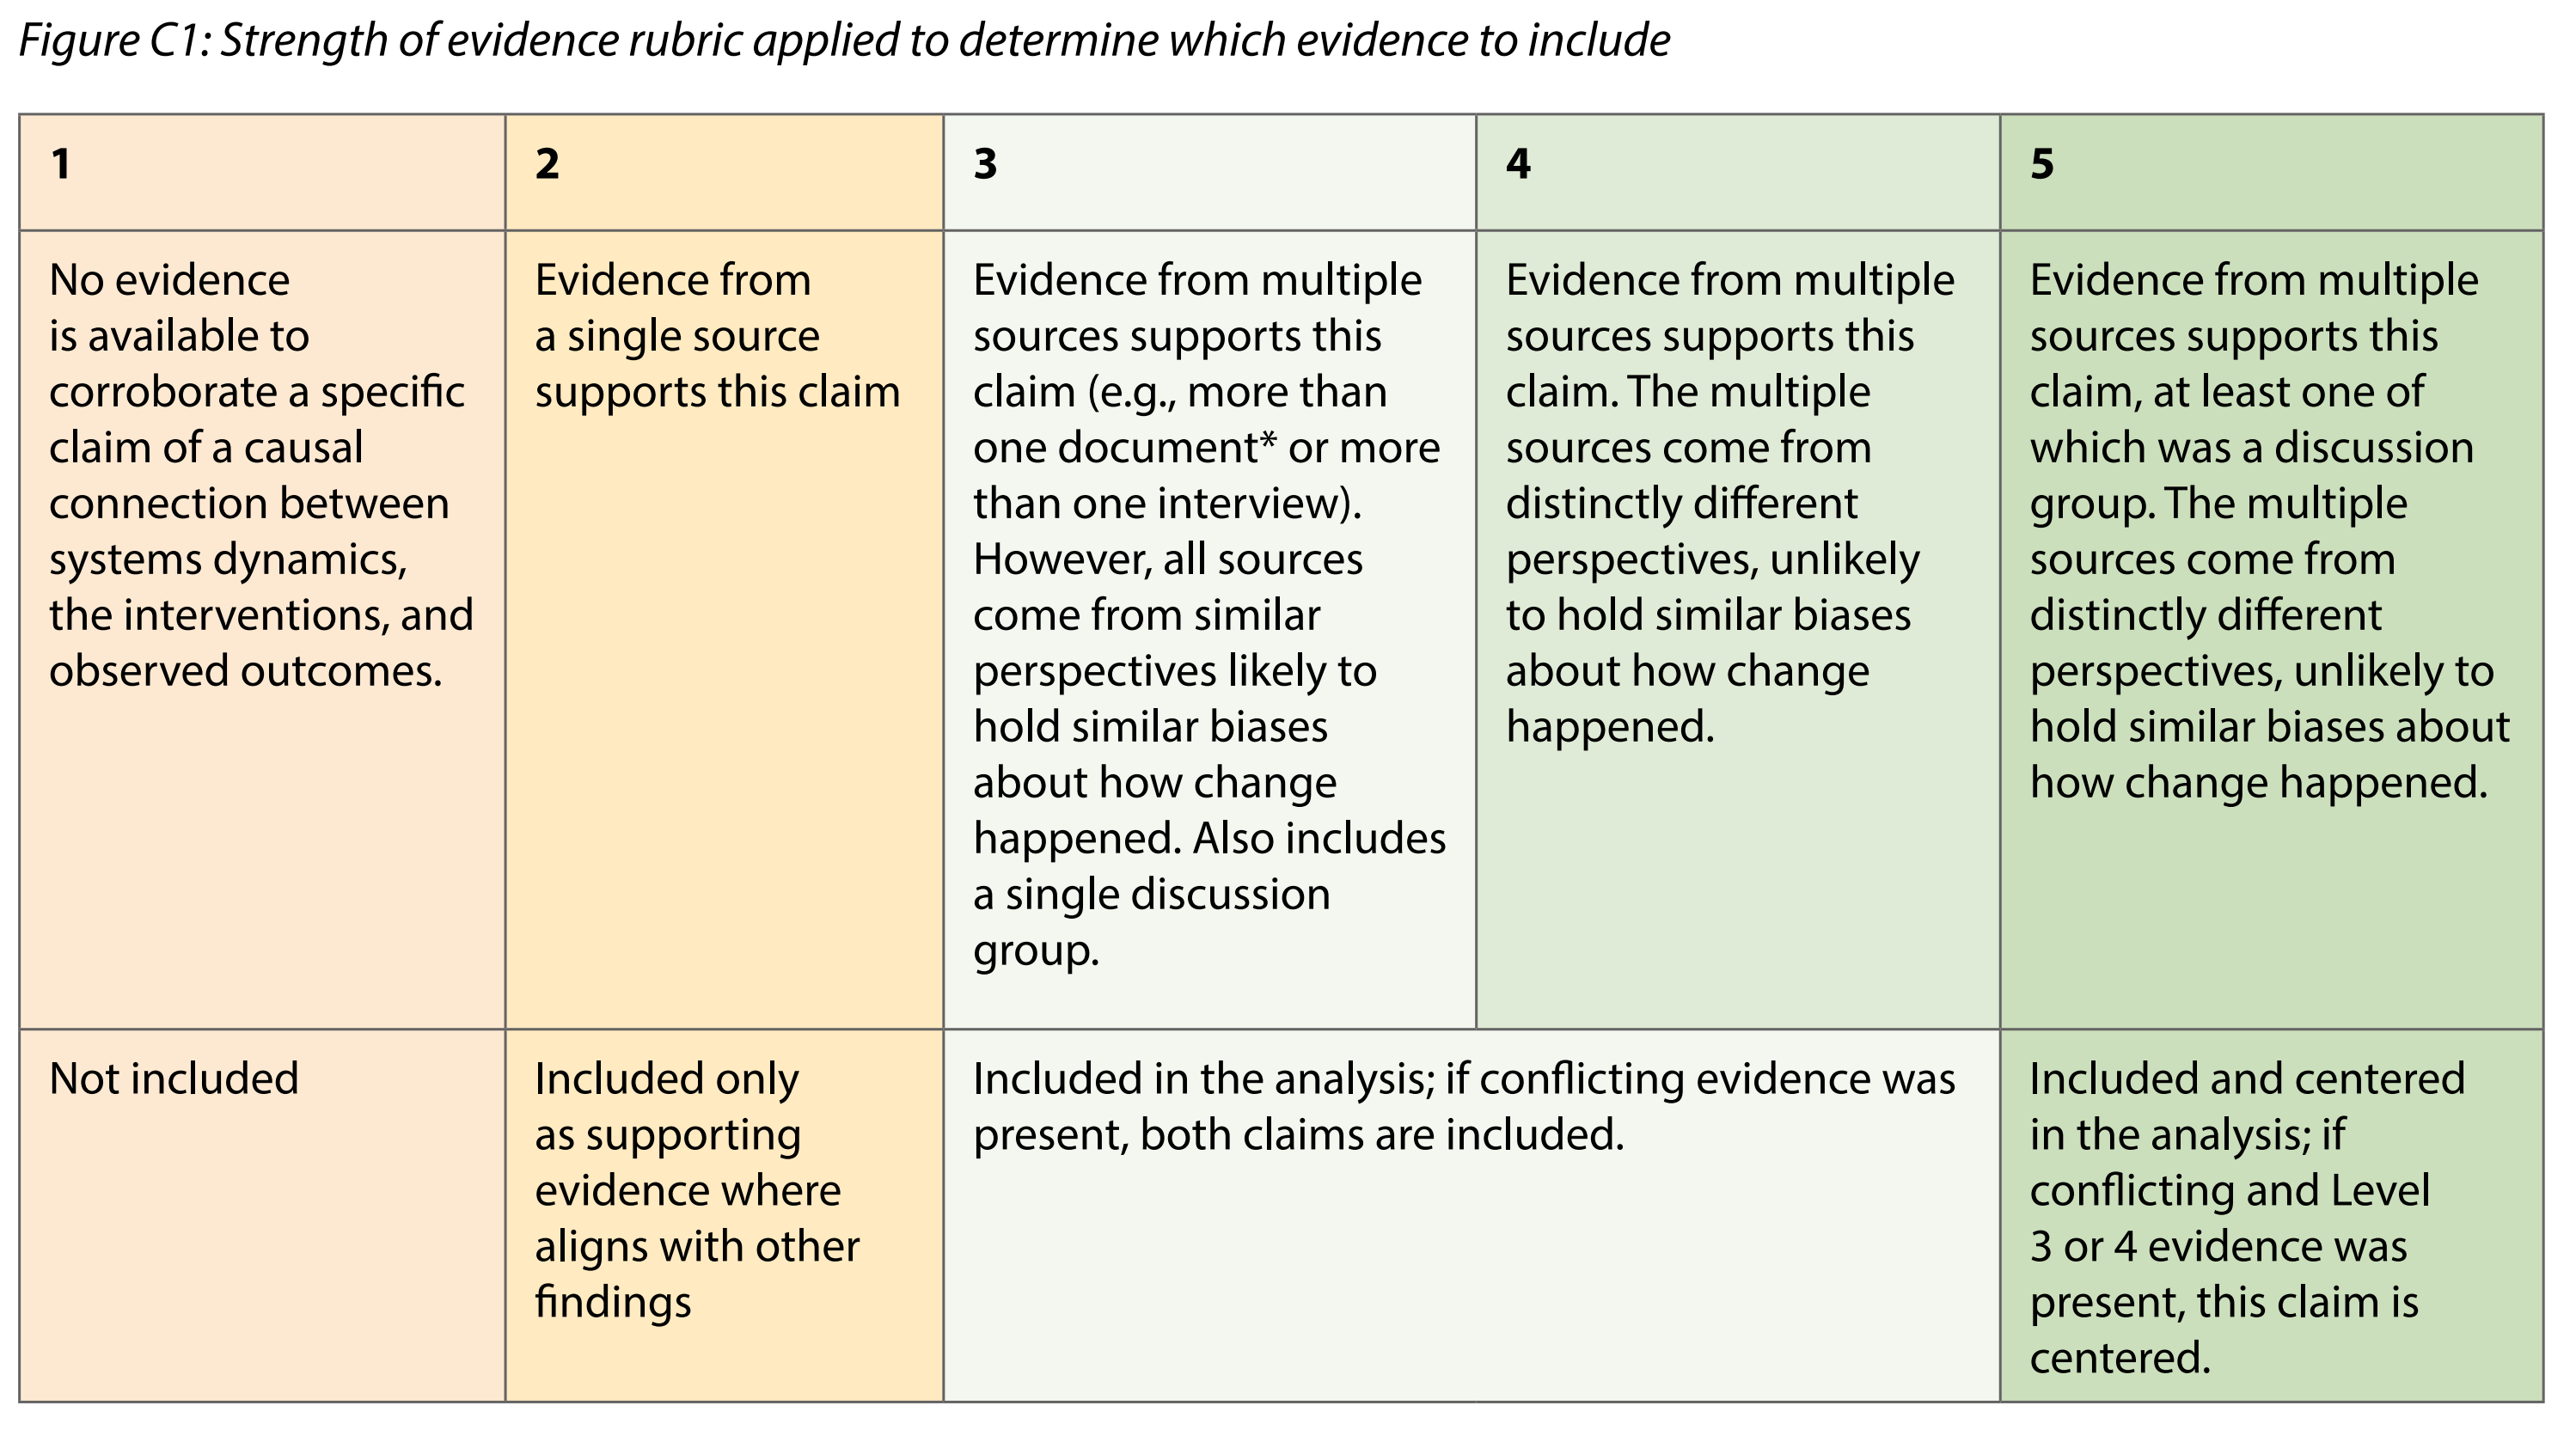
In (2026), here is the matrix which Jewlya Lynn and colleagues used.
 (2026)
My feeling is that, like Jewlya, we probably want to collapse all this information to just a single dimension, perhaps 1-5.
Noting absences#
Normally you'd add one assessed link for each bundle of Unassessed links, and in the UI you have a switch or filter to show either the one or the other, which then determines what you see in the outputs (maps and tables).
But there is nothing to stop you putting in an Assessed link for a bundle for which there are no claims at all. That is something which has been hard in Causal Map up to now.
Something else to think about#
We add these "assessed" links on a per-bundle basis. But the bundles might not consist of raw labels. We can add them also for filtered labels, e.g. after zooming or after applying soft recoding.
Not so relevant in our case:#
In Aston (2019), based on Mayne (2014), Tom Aston came up with this cube, which suggests an assessment based on significance, contribution and strength of evidence. This does not make quite as much sense in our context, because he is coming from a different place. For example, you are perhaps doing some kind of process tracing and are looking at one particular part of one pathway and asking what's the evidence that this foreground link is having a significant contribution to some outcome. Whereas in causal mapping you have the ambition to have captured information about all the different important contributions in parallel.
What we are proposing here is not specifically about ranking different contributions one against the other, though you could do that too.
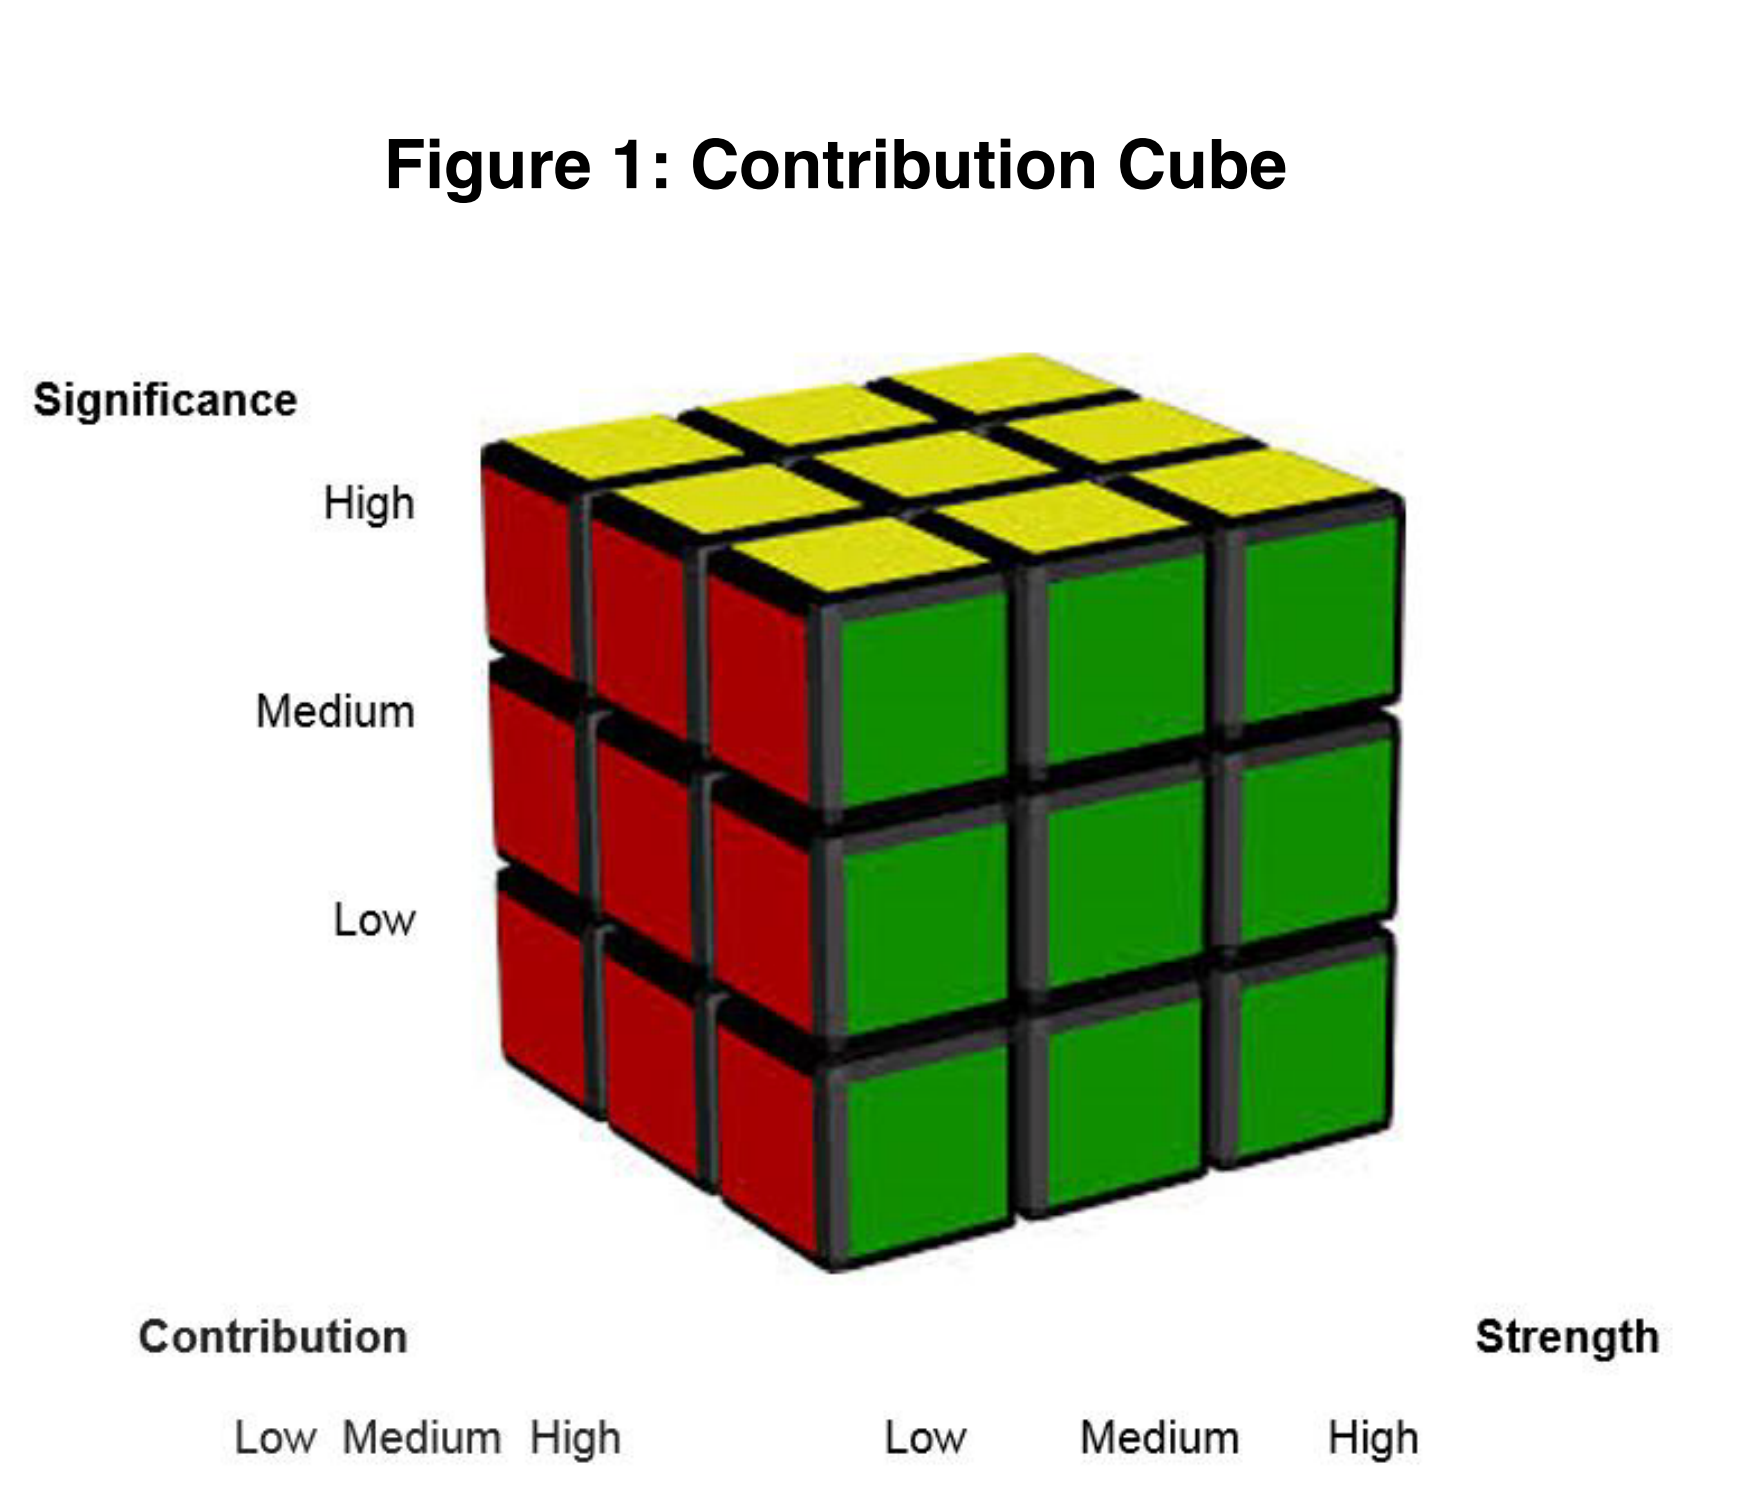 Aston (2019). Note "Strength" means "Strength of evidence".
Also Tom & Marina have a more sophisticated set of rubrics.
References
(2026). HU Seafood Retrospective. https://www.policysolve.com/resources/retrospective.
Aston (2019). Contribution Rubrics. https://media.licdn.com/dms/document/media/C4D1FAQE1laRi0vrFrQ/feedshare-document-pdf-analyzed/0/1620553059516?e=1687996800&v=beta&t=bFr7dhpZ-slluV8ne1cERFelwINIaEzsQN8fiF_75gQ.
Mayne (2014). Contribution Rubrics 1.