Data source and processing#
Data source#
We used Google News RSS search (site-filtered by source domains).
- Data route: Google News RSS query endpoint (
news.google.com/rss/search) - Scope: US-English (
hl=en-US,gl=US) - Source control: fixed source-site allowlist in the collection script
- Proportional sample sizing: January 2020 to February 2026
Query-term list (US politics focus):
trump, covid, jobs, employment, economy, biden, vance, musk, kamala harris, maga, republican, democrat, white-house, president, election, supreme court, voter, votes, voting, campaign, senate, house of representatives, congress, epstein, tariffs, doge, ice, immigration, deportation, border, politics, party.
A row is only kept if the assigned query_term appears in that row’s title or snippet text.
Processing pipeline#
- Build month-by-month RSS queries by term + source site +
after/beforedate bounds. - Fetch RSS results in small parallel batches with retry/backoff and pacing.
- Parse headline, link, date, source label, and short snippet from each item.
- Keep only rows where the
query_termis present in title/snippet text. - Deduplicate by URL and story key.
- Convert publication date to UTC-like timestamp string.
- Draw a month-balanced, source-balanced sample to
top_n. - Save monthly checkpoints to output CSV during the run.
- If rerun with an existing output CSV, resume from the month after the latest completed month in that file.
Target row count is proportional to the selected timespan (anchored to 12,000 rows for Jan 2020 to Feb 2026).
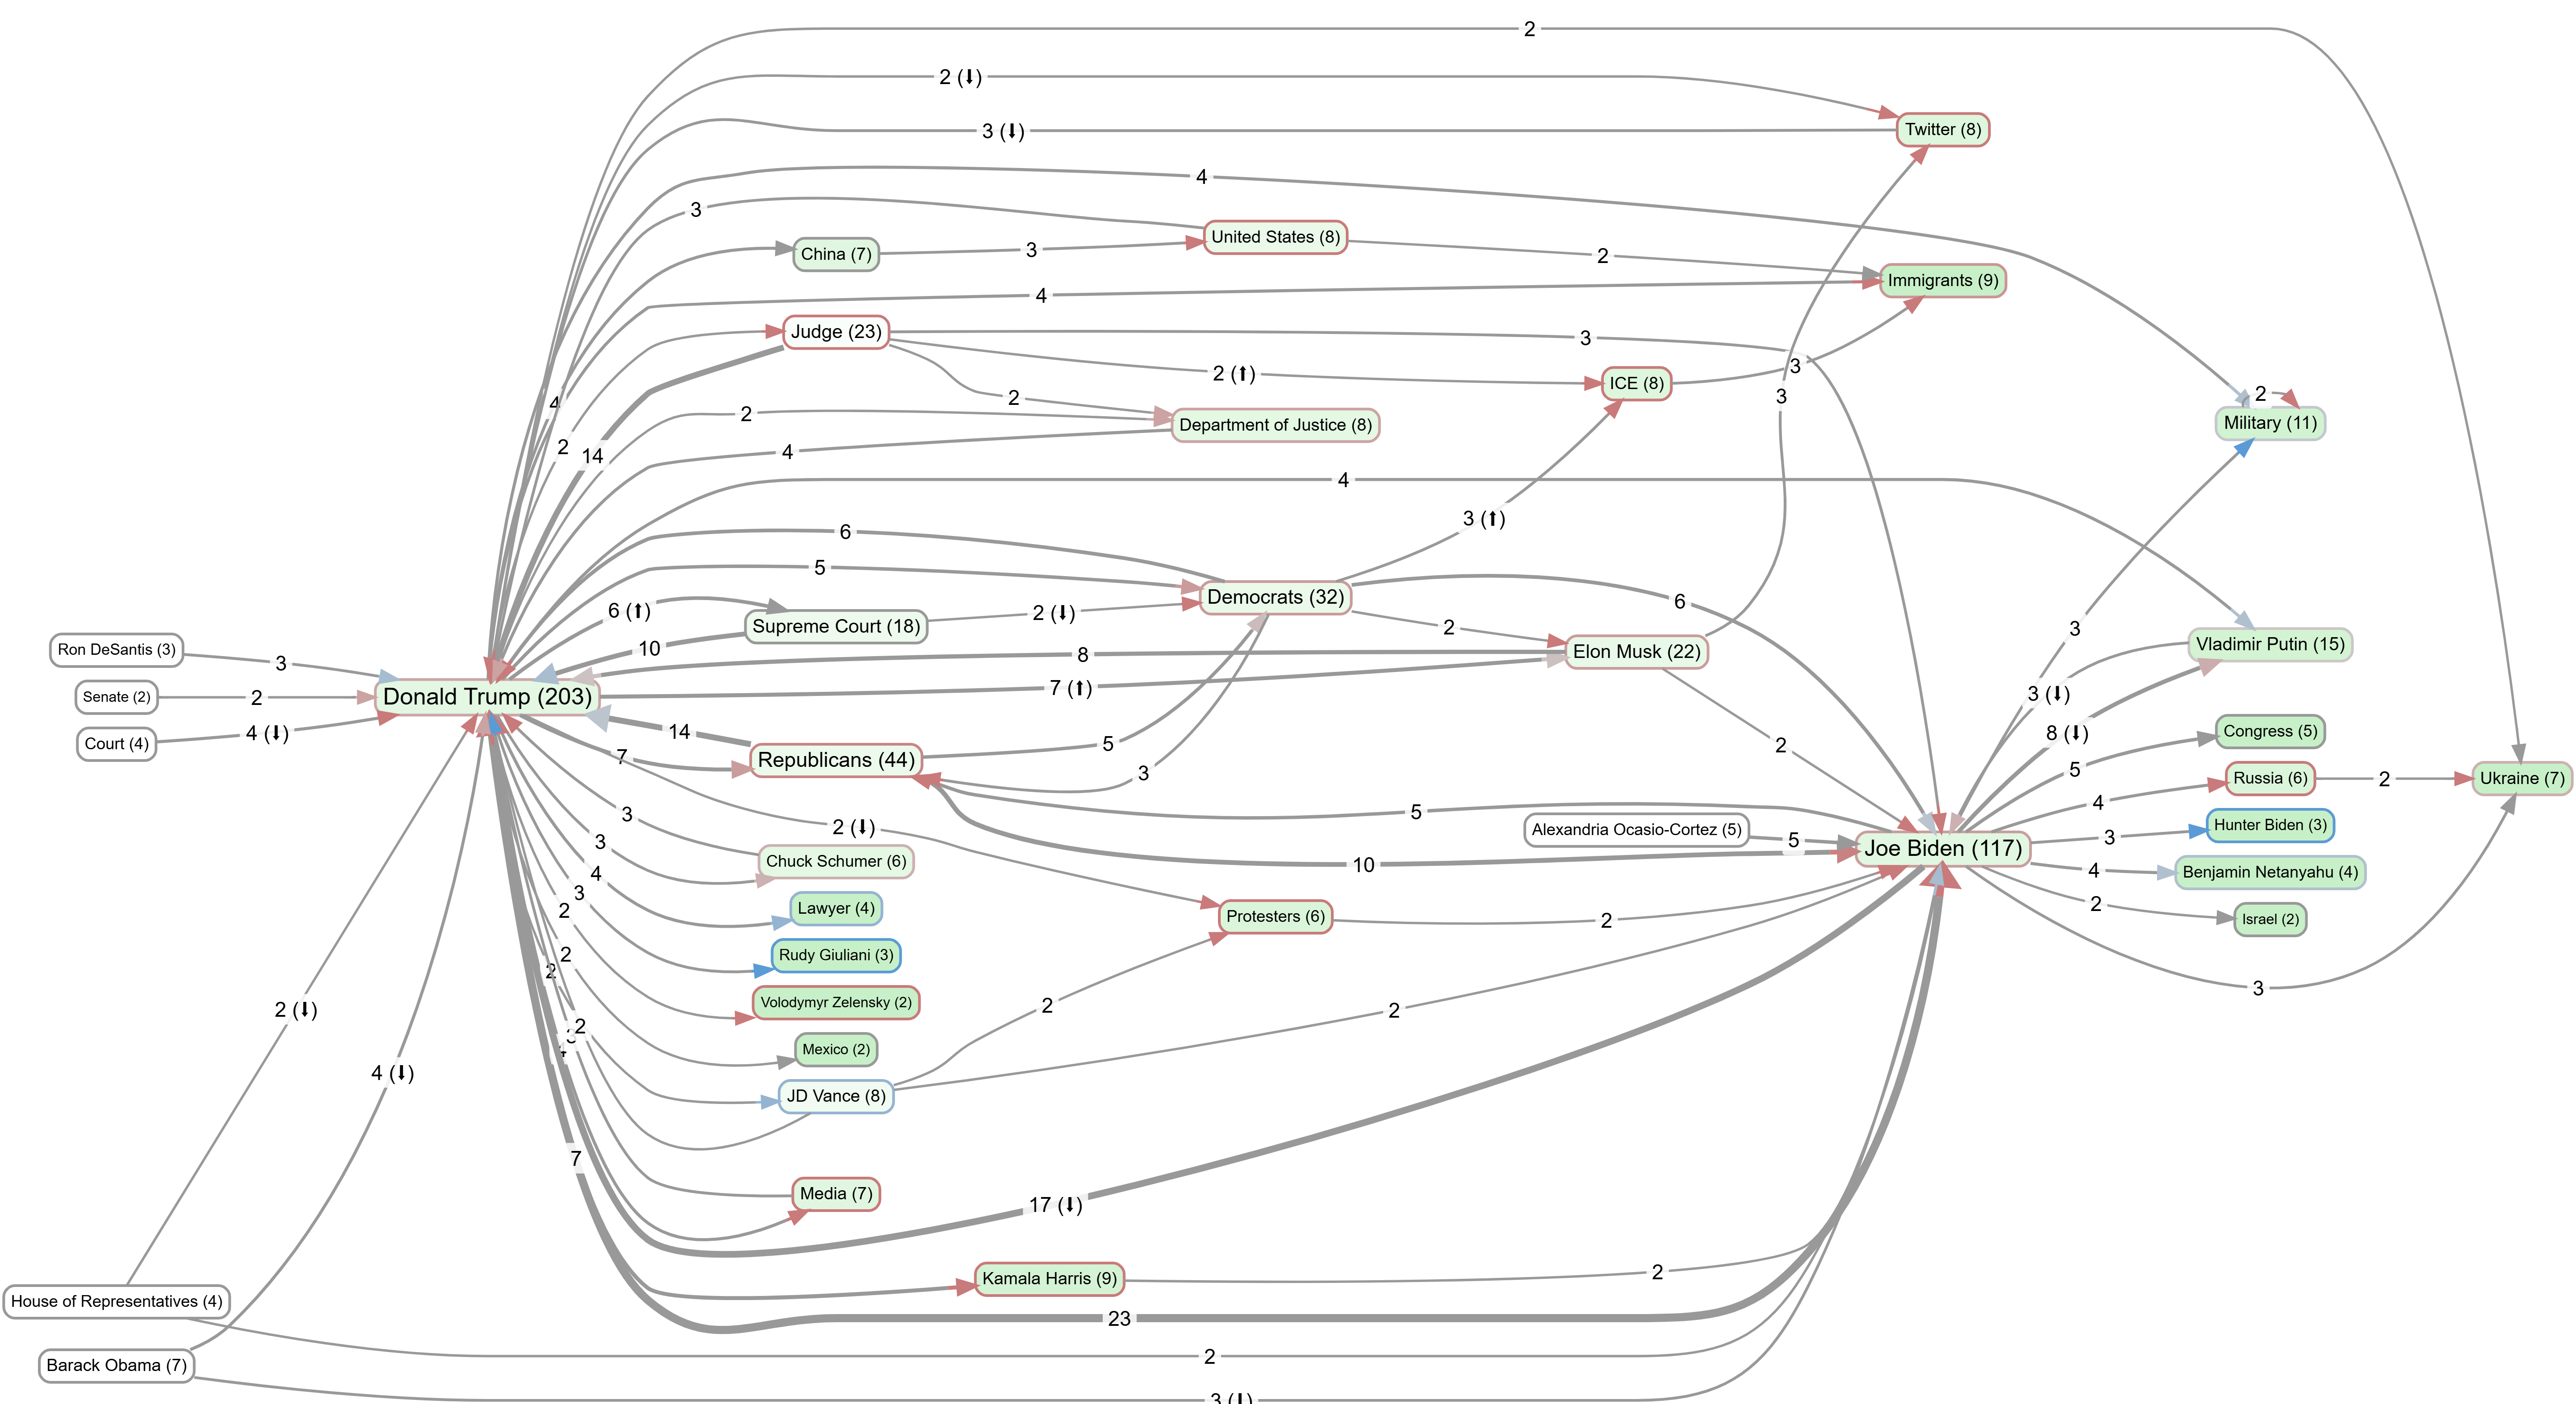
Link identification for social map#
From sampled text, links are coded using the same social-link logic described here !:
- Nodes represent social actors (people, groups, institutions).
- Directed links represent actor-to-actor relationships (not abstract causal mechanisms).
- Relationship labels/tags are attached to each link.
- Sentiment and time labels are added where possible.
The resulting table is converted to app-compatible link columns (Cause, Effect, Tags, plus metadata) for mapping.
Animation method#
Animation follows the Causal Map app’s Animate filter behavior documented in causal-map-extension/webapp/README.md:
- Select one link field to define frames (for example month or another time field).
- Optional cumulative mode includes all earlier frames up to the current frame.
- Frame construction respects pipeline order, so filter ordering affects what appears in each animation step.
Cumulative animation

Attribution note#
Google News RSS is an aggregated discovery feed, not a publisher ranking API. Terms such as “top” in this workflow refer to sampling rules in processing (filters and balancing), not editorial prominence.
Significant changes over time