Chapter Overview
Because the output is a structured network, we can apply a range of queries to explore the data. This gives us a library ofΒ pre-existing approachesΒ to askΒ practical questionsΒ about the causal landscape described by the participants...
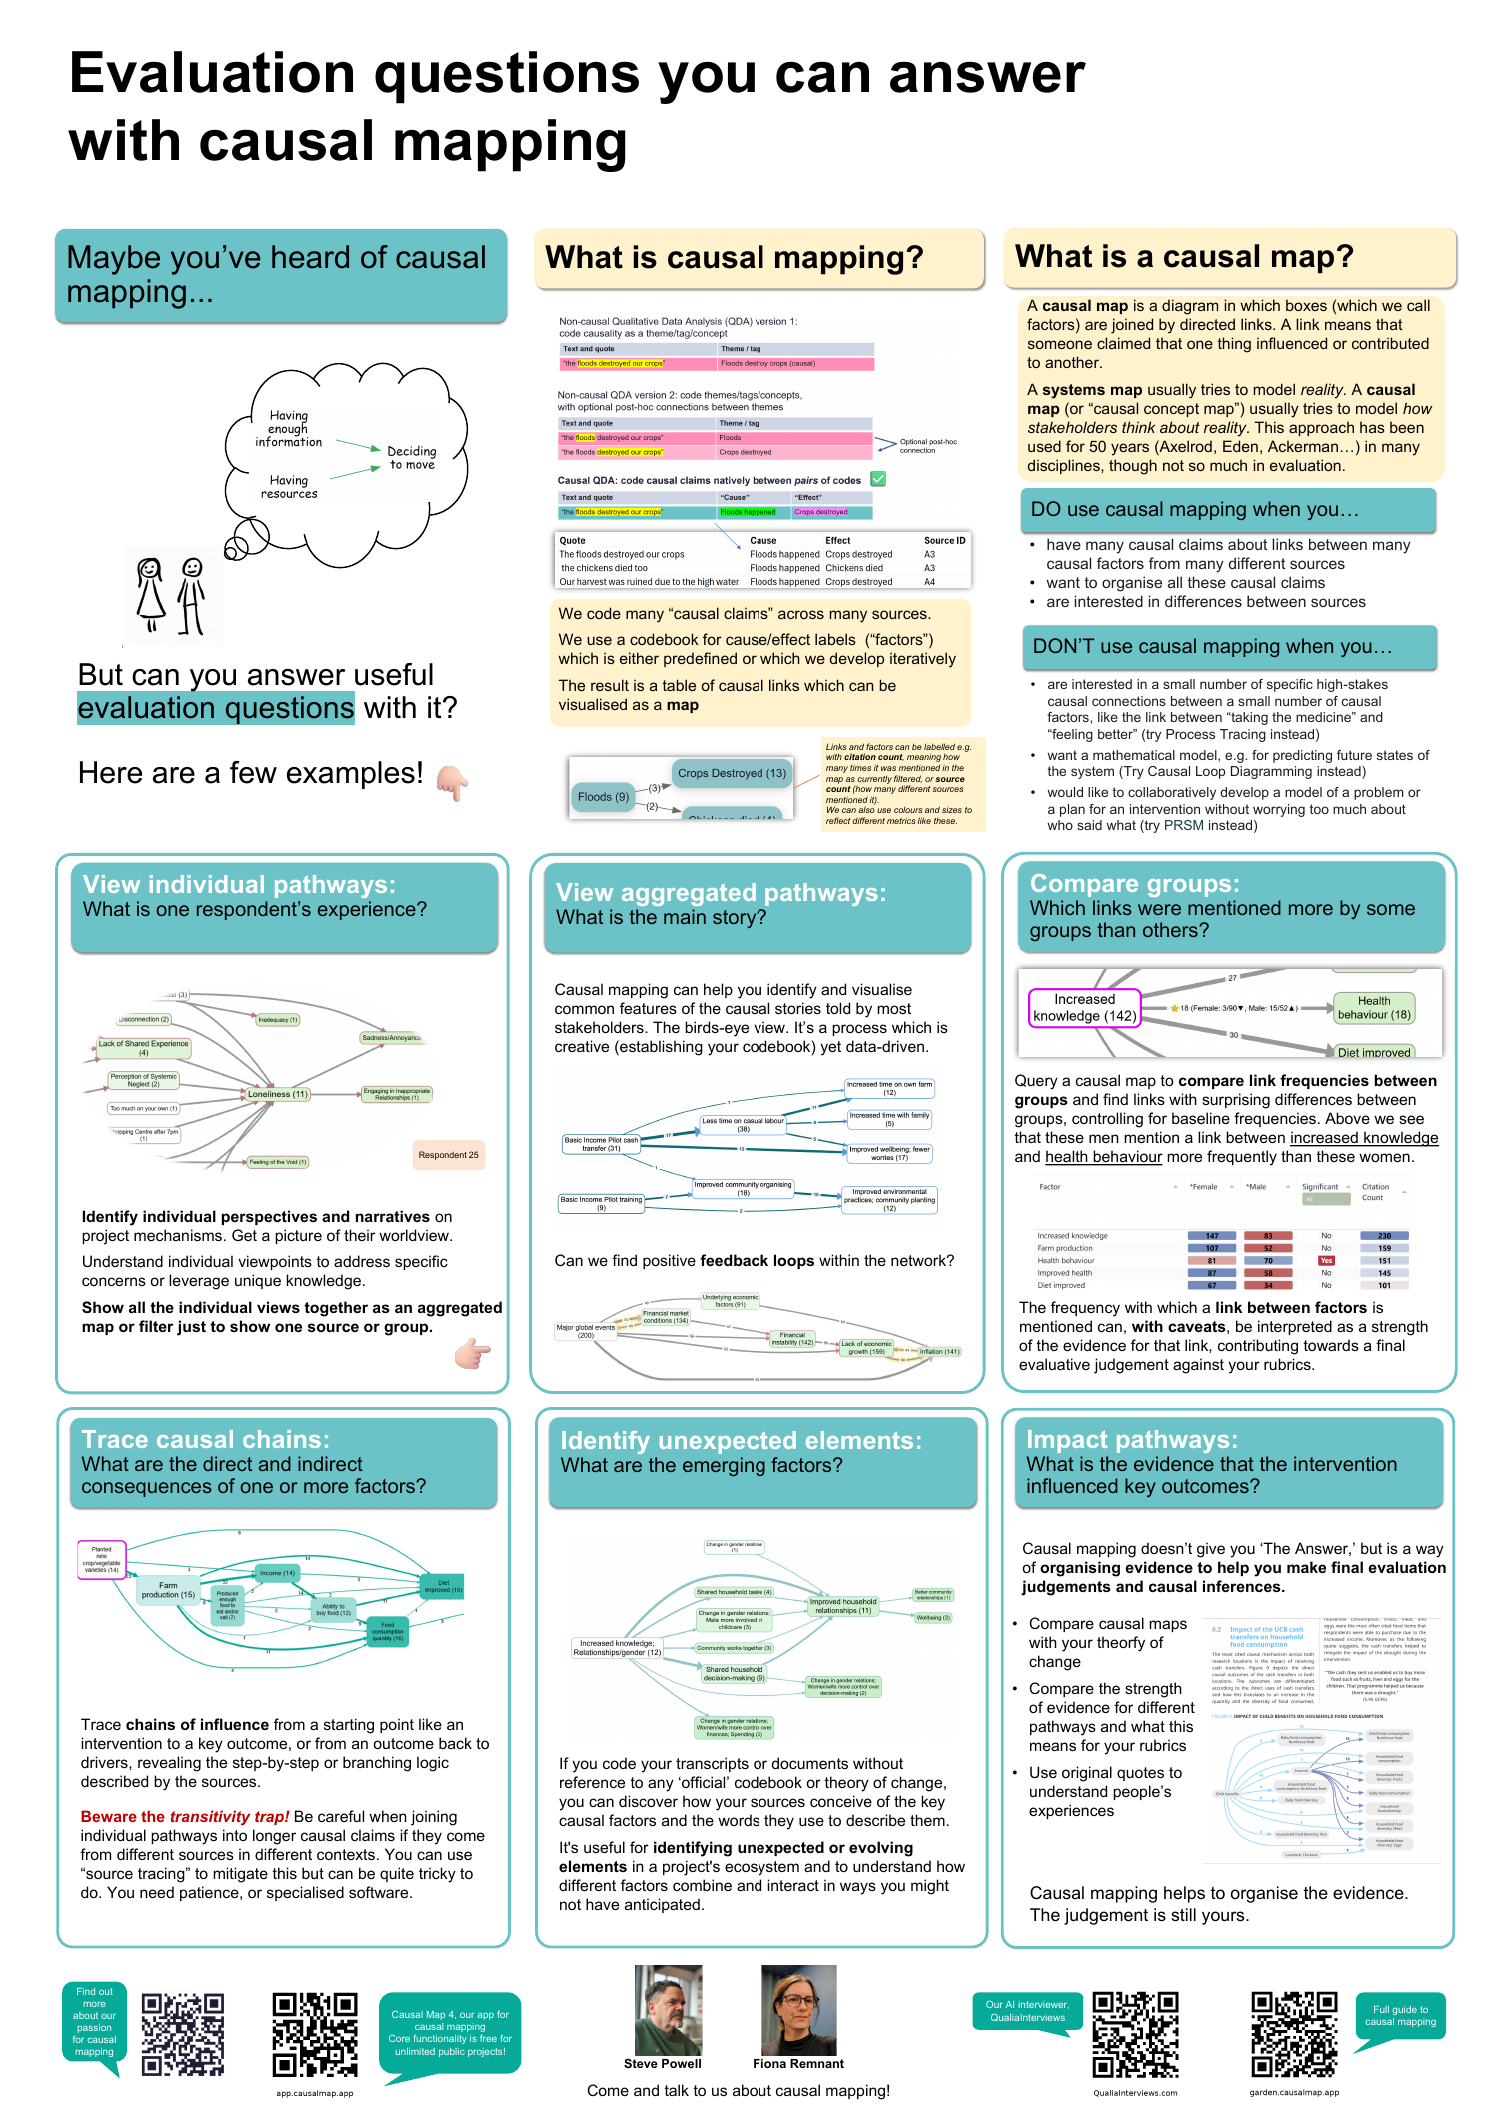
This question asks about individual perspectives on mechanisms and outcomes. By viewing the results for each source in turn you can identify sources reporting specific and unusual pathways of change and analyse individual viewpoints in depth.
Creating overall maps provides a top-level view of what your sources report about the system.
Writing the story for a typical source helps to create an engaging 'human' story, bringing your data to life, providing a tangible example that represents the broader trends in your dataset.
It is important to frequently return to the original quotes associated with each factor or link to understand how different stakeholders interpret and talk about key concepts. This can be done in Causal Map by clicking on a link in the interactive map, or by printing out quotes for a particular filter (e.g. just for a single bundle of links) with additional context and metadata.
Similar to overall frequency counts in non-causal qualitative coding ("which themes are mentioned most often?"), we can count the frequency with which particular factors (causes and effects) are mentioned: which causal factors are mentioned most often?
The number of citations can be a useful measure of importance, but it can be distorted if one source mentions some factor a lot of times. A useful alternative is to count the number of sources that mentioned a factor or link at least once.
What do we even mean by βoutcomeβ? A factor might have a lot of incoming links, so it is often mentioned as the consequence of something, but it might also have a lot of outgoing links, so perhaps plays more of an intermediate role. One way to answer this question is to calculate the βoutcomenessβ for each factor: the number of citations of its incoming links divided by the total number of times it was cited.
Just as we can identify the factors which are in an absolute or relative sense most frequently mentioned as outcomes, we can do almost the same to identify key drivers:
- Identify those with the highest number of outgoing links
- Or identify those with the lowest outcomeness score.
The simplest way to compare groups is to make separate causal maps for each group (e.g. men/women, project A/B, or by age group), and visually compare them. This allows you to identify common patterns and context-specific factors.
We can directly compare groups to find factors or links mentioned more by one group than another using a statistical test to find the most surprising differences between groups, taking into account the underlying frequencies.
Where there are many sources, it may also be useful to identify which sub-groups of sources are substantially different from one another in terms of the stories they tell.
One way to do identify emerging or unexpected factors is to use the elements from your theory of change as your codebook while coding and only adding other elements when necessary, making a note of these additional elements.
One way to do this is to use the elements from your theory of change as your codebook and only add other elements when necessary. Validated pathways of change (by showing which mechanisms are observed on the ground) and find gaps where expected pathways might be missing or where stakeholders list elements were not anticipated in the theory of change?
One of the most exciting applications of causal mapping is to assess change over time within a system. If we apply a systematic approach to coding (using blindfolded manual coding or AI-supported coding) we can compare the frequencies with which links or factors are mentioned over time. This becomes particularly interesting when applying inductive coding, so that new and emerging phenomena can be included into the codebook. Re-applying new codes to previously coded data would be very tedious with manual coding but is easy to do with AI-supported coding: [[860 Transforms Filters -- Soft Recode with Magnetic Labels]]
Building on the previous example, you can analyse the sentiment in particular of the immediate impacts of your project or intervention.
Focus on a particular element of your project to understand the direct and indirect influences leading to a specific factor and all outcomes it contributes to. This helps in exploring the role of the factor as both an outcome and an influence within the causal system.
Map out all direct and indirect paths flowing from selected factors to:
- Understand both intended and unintended outcomes
- Identify feedback loops and circular relationships
- Understand the causal pathways from a specific factor and how it relates to other causal links and factors
Looking upstream is just the opposite of looking downstream.
We can think of a causal map as a database consisting of two tables, the links table and the sources table. We don't need to have a separate table for the factors because the factors can be derived from the links table.
What are the main causal pathways from an intervention to an outcome? We can trace chains of influence from a starting point like an intervention to a key outcome, revealing the step-by-step or branching logic described by the sources. We can even compare the strength of evidence for different pathways.
How robust is the network of evidence for the influence of one or more "driver" factors on another set of "outcome" factors?
How much evidence is there for the influence of our intervention on a valued outcome? Is that a lot? Can we compare these numbers across pathways?
Because we can understand the map as a network, we can ask network-style questions. For example we can look at measures like "betweenness" to identify factors which are central in the network.
There is a host of other analytical lenses available, for example, are there relatively isolated islands within the network? Are there sub-systems which operate more on their own? How sparse or dense is it?
Systems thinking gives us ways to identify possible leverage points within a network.
Can we identify positive feedback loops within the network which might serve to maintain or exacerbate phenomena?
Causal mapping gets really useful when you start to combine the different questions you might want to ask in order to answer more sophisticated questions. We can think of many of the techniques as filters which filter the view in a particular way. Using multiple filters allows you to build up an answer to a question. Usually, order matters.